Last Day!
First of all, a huge THANK YOU to everyone in the archives department here at OSU, especially Laura Kissel and Lisa Carter for making this internship not only possible, but an incredibly enjoyable experience. There is an amazing group of people here, a group I am happy to have been a part of even if only for a short time.
__
Another big thanks to the original camera men. If not for them… well, this material would not exist. I would exist (I hope), I just wouldn’t be here.
I saw more of Antarctica than I ever imagined, all in a climate controlled conditions. Kind of like a vacation but not really like a vacation at all.
Stay tuned! Follow the Byrd Polar Research Center Archival Program and The Ohio State University Archives on Facebook.
__
I head off for my own adventures now. First, time for pizza.

Thanks for reading everyone!!
Why do science archives matter?
Science is about the future, right? Breaking new ground, exploring new territories, and dare I say it? Trailblazing. With this in mind, why would a climate scientist look at old photographs from the 1930s or an astronomer tear themselves away from the telescope to look at a Chinese manuscript from the Middle Ages?
Here are some examples of when historical reference material is utilized for scientific understanding:

This image shows the calving front, or break-off point into the ocean, of Helheim Glacier, located in southeast Greenland. The image, taken in May 2005, shows high calving activity associated with faster glacial flow. This glacier is now one of the fastest moving glaciers in the world. Image credit: NASA/Wallops
First of all there is the difference between ‘climate’ and ‘weather‘. The weather changes everyday, but the climate changes over a long period of time, at least 30 years is the standard minimum. Today’s climate researchers need access to previously recorded data and current data from other institutions in order to recognize and understand the changes taking place around the world. For example, this OSU research news release from May of this year:
“Discovery of Historical Photos Sheds Light on Greenland Ice Loss
COLUMBUS, Ohio – A chance discovery of 80-year-old photo plates in a Danish basement is providing new insight into how Greenland glaciers are melting today.”
Read the full story here. Some of the photos of the 7th Thule Expedition of 1932-1933 and other relevant data can be found here:
“After the initial use the images were classified and not generally accessible. Later, they were archived in a citadel outside Copenhagen, and knowledge of their location forgotten.”
(I have yet to read how these photos were re-discovered.)
___

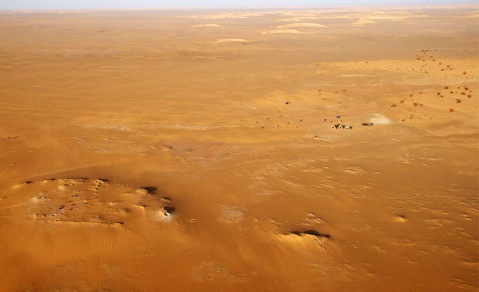
The Gobero archeology excavation site is an utterly desolate area of the Sahara, so remote that camels are never seen. This wide aerial view of camp shows distant sand dunes, the team’s tents and a tiny group of archaeologists excavating skeletons (lower left). Looking at it today, It is hard to believe this was the Green Sahara thousands of years ago. (© Mike Hettwer) # (Photo from “Lost Tribes of the Green Sahara” in the Sep. 2008 issue of National Geographic.)
And although this is well-known now, it still blows my mind:
“The Sahara, the world’s largest desert, was once fertile grassland. This fact has been common knowledge in the scientific community for some time, but scientists are still grappling with historic data to determine whether that transition took place abruptly or gradually.”
Full article available here. The phrase that catches my eye is “grappling with historic data.” First of all, grappling is just a great word, but historic data sets in motion the butterflies in my stomach. Where did this ‘historic data’ come from? Climate scientists are working with archaeologists to uncover the grassland ecosystem that once existed in the Sahara. This data provides clues to the climate changes that occurred 4,000-9,000 years ago. (I know, it’s a big window, but this is the range of data scientists and archaeologists are working with.)
___
A very recent example to point to is the Venus Transit. I attended an excellent Transit-viewing talk hosted by David Pogge, a professor of astronomy here at OSU. Although I did not have the opportunity to view the transit through the telescope (a conspiracy by the clouds), the lecture was fascinating and historically informative. Plus, we were able to watch the transit via online on a larger screen/projection than I have at home, by which I mean my 13″ computer.
The transit of 1761 was documented by the one of the first international scientific expeditions. Keep in mind 1761 was in the midst of the Seven Year’s War and several of the scientists were from France and Britain, so travel was limited and access to different points was touch and go. These scientists paved the way for collaborative astronomical research. Anyway, the Venus Transit is a good example of how scientists search for extrasolar planets. When Venus crosses the Sun, it blocks a percentage of the light we receive from the star. With this model, astronomers can measure the light curve from planets passing in front of distant stars. At first, they only discovered large gas giants, but the technology has advanced enough to where astronomers can find earth-size planets (or even the size of Venus, but I’m not sure). This research also leads to searching for habitable planets, or humanly habitable I should say. On earth, we have colorful sunrises and sunsets thanks to many of the naturally and unnaturally occurring gasses in our atmosphere. The colors emitted by these gases are view-able from Earth’s telescopes as the planet passes in front the star allowing astronomers to make conclusions about the planet’s atmosphere.

Transit data are rich with information. By measuring the depth of the dip in brightness and knowing the size of the star, scientists can determine the size or radius of the planet. The orbital period of the planet can be determined by measuring the elapsed time between transits. Once the orbital period is known, Kepler’s Third Law of Planetary Motion can be applied to determine the average distance of the planet from its stars. Credit- NASA Ames
___
One of the most studied objects in the sky is the Crab Nebula. During the 20th century, astronomers discovered the nebula was growing and using mathematics I could not possibly comprehend, determined the supernova occurred about 900 years ago. This matched with historical records of a bright but short-lived star observed and documented in 1054 by Japanese, Chinese, and Arab astronomers.
This is the kind of information that exists in archives. Astronomical archival collections have incredible potential for observational data since, ironically, as the telescopes have advanced over the yearsso has light pollution around the world.
___
I won’t delve into this but it is worth a mention:
“Niels Bohr Library & Archives staff have just added an important new search feature to the American Institute of Physic’s online oral histories (http://www.aip.org/history/ohilist/transcripts.html). Users can now search for any word they wish to find across over 770 online transcripts.”
Much of the above calls attention to the mammoth in the blog post asking us to consider “What’s the difference between an archive and a database?” The answer to this question depends on who you ask. The term archives applies to a collection of materials organized around a similar theme. They most often consist of primary resources, records, and documentation, while other items will occasionally be thrown into the mix. For example, the Byrd Polar Archives covers polar related material, and the University Archives at OSU stands as the official memory of the university.
So, if you ask an archivist, they would likely say an archives is different from a database. Then if you ask someone who runs a database, they will often use the two words interchangeably. I would venture to say a database is more about access than historical record keeping, but this is still a blurry liine. However, this inter connectivity creates a collection of other terms used frequently but are even less clearly defined: the digital archive, data-archive, digital repository. These terms tend to be used interchangeably as well.
By the way, “an archives” or “the data are” is correct grammar. According to SAA, “archive” is regularly used in information technology literature to describe collections of backup data.
___
As I have mentioned before, the Polar Archives is partly under the umbrella of the Byrd Polar Research Center (the other part is under the Libraries Special Collections), which also includes the Goldthwait Library. Science researchers most often use the library while historians take advantage of the archives. This might be a stretch but it is very possible one of the crewmen on one of the Byrd expedition ships saw something in the night sky at sometime and the right astronomer has yet to pay a visit to the Polar Archives. Or probably any astronomer. Ever.
The opportunities for outreach are tremendous. The Archives regularly brings in classes with projects involving the use of primary resources or invites teachers to make lesson plans from the material. The former was a previous and successful endeavor. Keep an eye out for more in the future.
I’m sure I’m leaving several very important points out, but I have other internship responsibilities. In all honesty, this post was an excuse to talk about archives, Gobero, the Crab Nebula, and extra-terrestrial life in one go.
The questions I leave you with: is an archives data, is data an archives, or is the difference irrelevant? What different types of research material and information might be available in the archives? Please share your thoughts!
Happy Friday all! As someone pointed out, it is not just Friday, it is a full day of Friday! Have a great weekend!
___
Bonus: Not related to the above (much), but my polar/glacier news sensors were in full alert mode this morning and the video is breathtaking: Digital Nomad: Travel by Glacier by Andrew Evans.
Polar Cohort
While the Byrd Polar Research Center does some amazing work (see Monday’s post), other research groups are studying some different aspects of the poles and glaciers.
Hosted by NASA, researchers are currently working on Operation IceBridge, a six year mission begun in 2009 to map the polar regions including the ice sheets, glaciers, and snow ice. The airborne teams use remote sensors to measure the surface elevations of the polar regions, specifically the areas most strongly affected by climate change. During the spring campaign the teams visit the Arctic, flying out from Alaska and Greenland, in *March-May. They visit the Antarctic from October- November of each year and are home based in Punta Arenas, Chile for the duration of the fall campaign. The airplanes are essentially flying laboratories. Check out some of the neat measuring instruments. IceBridge is actually a project designed to fill in a data-gathering time gap: NASA’s Ice, Cloud and Land Elevation Satellite (ICESat) collected date from 2003-2009. As the name suggests, the satellite took elevation measurements as well as atmospheric conditions of the polar regions. The next satellite, ICESat-2, is expected to launch in early 2016. The second satellite will be able to take more detailed sampling of the elevations and atmosphere thanks to some upgraded technology. Until then, IceBridge offers researchers and other interested parties a unique opportunity to get aerial research and views of the polar regions. While the name is 100% representative of the project, the blog is wonderfully informative as well.
A few images captured by the NASA Operation IceBridge team:

Frozen fjord along northeast coast of Greenland as seen from the P-3 aircraft on May 14, 2012. Credit: NASA/Jim Yungel

NASA’s P-3B aircraft flies over a melange of floating ice where two glaciers meet in eastern Greenland, on Apr. 14, 2012.
_____
The Scott Polar Research Institute (SPRI) at the University of Cambridge studies Glacimarine Environments. The team examines how world seas are affected by the ice sheets and glaciers, primarily through measuring the icebergs, meltwater, and the delivery of sediments. More specifically, they study how the sediment is moved and distributed in the marine environment. The team uses a sediment corer to retrieve samples of the ocean basin, which are then analyzed and compared to other samples.
SPRI also takes another approach to Polar research via the humanities route. The Polar Social Science and Humanities Group studies family and cross-cultural dynamics, the evolution of religion in the arctic, endangered languages, and nomadic patterns, among many other things.
Plus, this sounds like it would have been fascinating to attend: Ghosts and apparitions in the field: an international workshop. (Long shot– If you’re reading this, and happened to have attended, let me know how it was!)
_____
Do not be mistaken in believing these endeavors are in competition. The thought could not be farther from the truth. Many of the institutes around the world are in constant communication and collaboration. Different research groups work together to make their groundbreaking discoveries, to collect and share data. Funding from multiple sources is fairly handy as well. If you happened to click on the Operation IceBerg link to the ‘neat measuring instruments’, you might have noticed nearly every piece of equipment they are using was developed and is managed by a different affiliated research group including the University of Kansas, Columbia University, Goddard Space Flight Center, and Wallops Flight Facility. No man is an island, nor is any research center apparently.
(Disclosure: I’m an archivist, not a polar scientist. If any reader notices any misconstrued information, please let me know.)
_____
And this! From NASA. This is just amazing. Study Finds Ancient Warming Greened Antarctica

This artist’s rendition created from a photograph of Antarctica shows what Antarctica possibly looked like during the middle Miocene epoch, based on pollen fossil data. Image credit: NASA/JPL-Caltech/Dr. Philip Bart, LSU
Pair the above with a dinosaur discovery back in 2003 of a previously unknown species on an island off Antarctica … you get prehistoric magic.
…which digresses to this relevant image of a near-future vacation:
(*Edit)
Byrd Polar Research Center
Last Monday, Laura, my supervisor, scheduled a tour of the Byrd Polar Research Center for the Archives department. The BPRC is the oldest and longest running research center at OSU. It was an exceptionally informative tour. Nate Patrick, our tour guide, packed quite a bit of information into one hour, and it was just the tip of the iceberg.
Pun intended. Har.
Really, we only saw a small portion of what goes on at the Center. The BPRC is home to ten different research groups studying the earth’s climate system, along the the Archives Program (represent! does anyone still say that?), the Goldthwait Polar Library, and the US Polar Rock Repository. The research groups include Glacier Environmental Change, which studies glacier changes due to the changes in climate and the Polar Meteorology Group, which studies the atmospheric conditions of the polar regions.
However, the department I was most intrigued by was the Ice Core Paleoclimatology Group. This groups study the climate history of the earth by extracting ice cores from glaciers around the world, not just the polar regions. Glaciers are also found on high mountains in the tropics as well, such as Mt. Kilimanjaro in Africa, or the the extinct Sajama volcano in Bolivia. By studying the ice core samples, the researchers can create a climate timeline of the earth: warm periods, ice ages and so on. To do so, they measure the dustiness and chemistry of the atmosphere, or volcanic and vegetation changes, among other things. For example, the earth went through a Medieval Warm Period and was followed several centuries later by the Little Ice Age, and the current science backs up the historical record of these accounts. If you don’t trust the wikipedia pages, I recommend reviewing some of the citations at the bottom.
Excellent introduction video with polar research scientists Lonnie Thompson and Ellen Mosley-Thompson:
Some other videos from WOSU, although intended for younger crowds, helpfully breaks down what the above details. (Also, the difference between climate and weather, two related but very different areas.)
Bonus: a library of rocks.
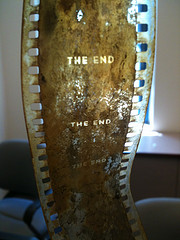
The End? Never!
 … of Decomposition Week… and this piece of film.
Not the end of the story.
Thank you for joining me for Decomp Week! I had some great feedback off-line, so a big thanks to everyone who has been reading this. Nitrate Day had the largest number of views this week and with good reason. Intriguing stuff for the film and archive nerds among us. As I mentioned (several times) these films represent only a fraction of the film collection in the Byrd archive. The majority of the films are in good and preservable condition. The work I’m doing now is to help preserve these films by performing film inspection, needed repair, cleaning, and rehousing, as well as reviewing content.
For more photos of the infamous representatives of the collection, check out the flickr set here.
(my desk. because i know you weren’t wondering.)
____
So far during this internship I have utilized several resources. Most predominantly for Decomp Week:
The Film Preservation Guide: The Basics for Archives, Libraries, and Museums. National Film Preservation Foundation. 2004.
Enticknap, Leo. Moving Image Technology. Wallflower Press: London, 2009.
“Film Preservation Handbook.” National Film and Sound Archive of Australia.
“Handling of Processed Film.” Kodak.
Pincus, Edward and Steven Ascher. The Filmmakers Handbook. New York: Plume, 1984.
“Museum Handbook, Part 1: Museum Collections.” National Park Service, U.S. Department of the Interior.
_____
Curious penguin hopes everyone has a great weekend!!


